
BOISE, Idaho — The state's two largest health systems are expanding their online resources to better inform the community about the COVID-19 vaccine.
Saint Alphonsus Health System and St. Luke's Health System say they have added an additional tab that will now be part of their COVID-19 data dashboards. This will help them be more transparent with the public about the supply, administration and efficiency of the vaccine.
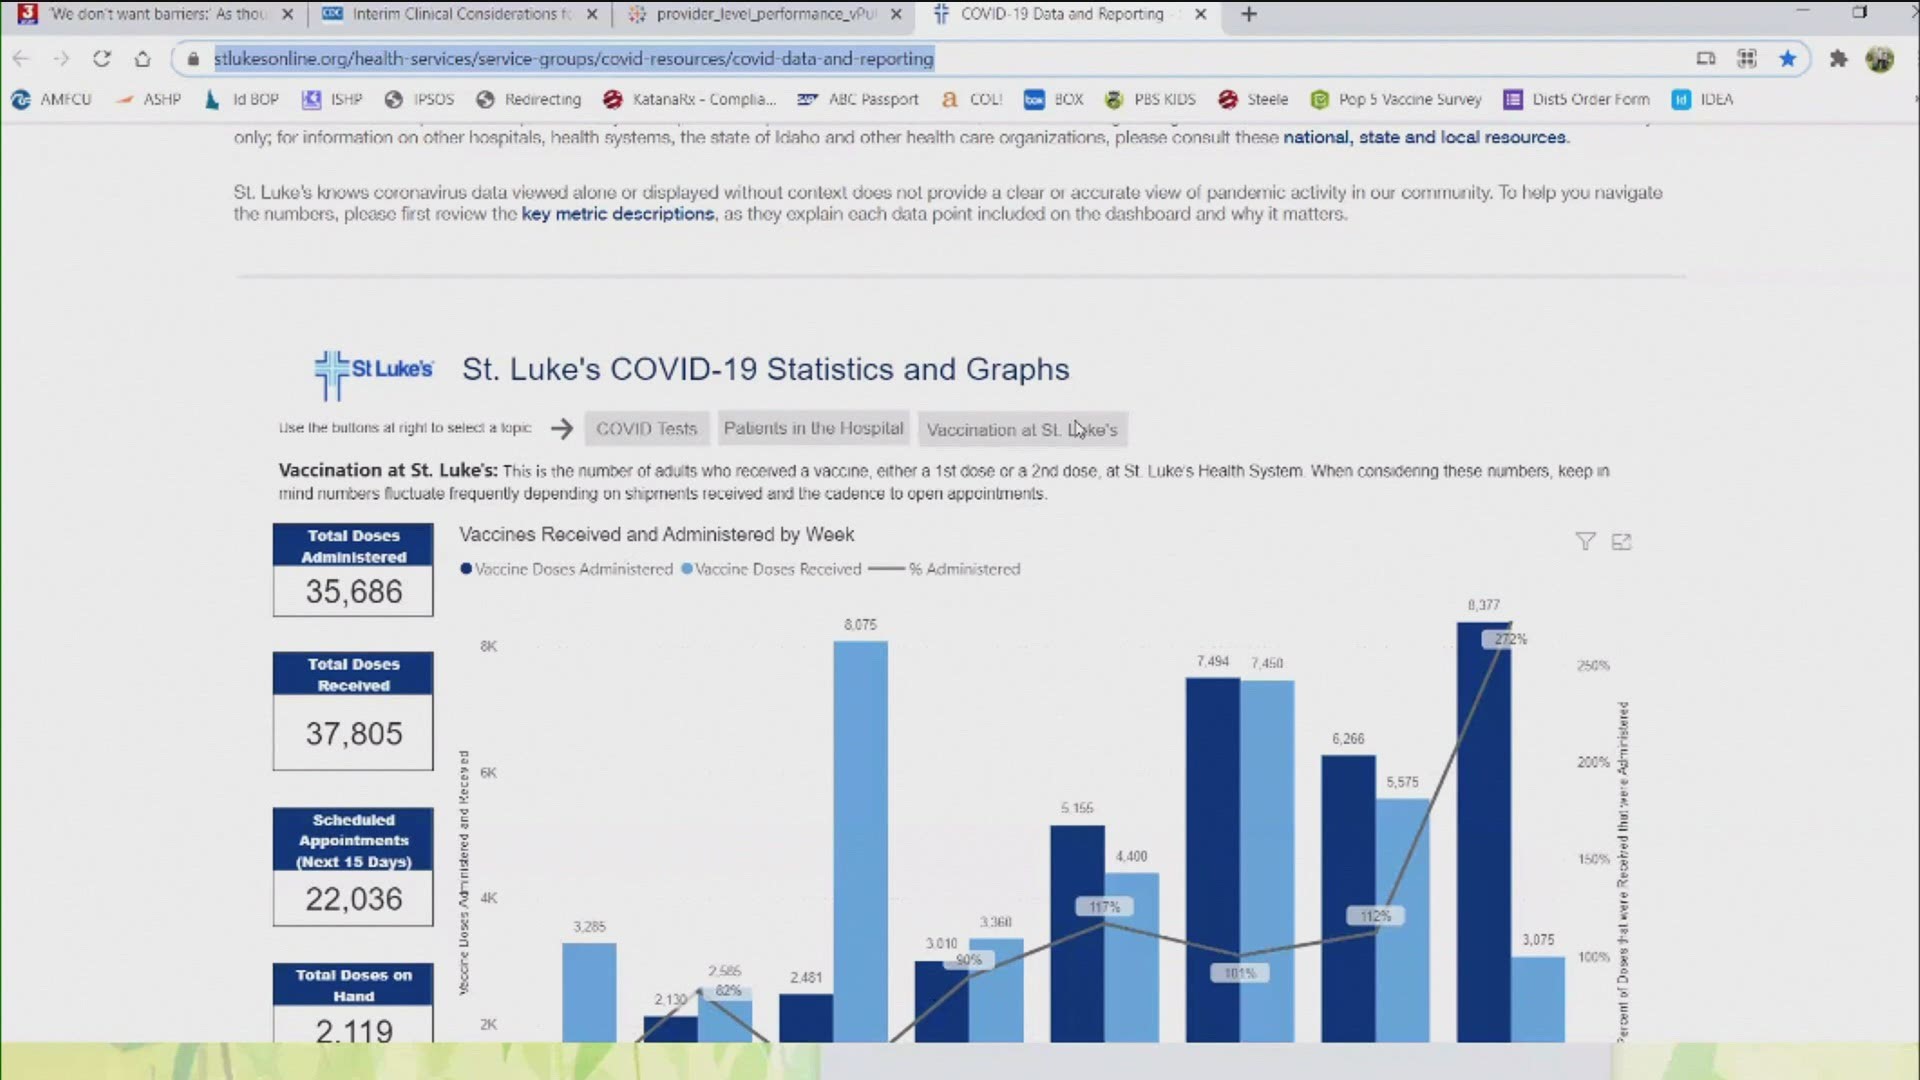
Scott Milner is Senior Director of Pharmacy for St. Luke's Health System. He says the data will be updated in their system and should be available on Monday morning.
"I feel like we've been able to hit the mark of trying to make sure that our vaccines that have been entrusted to us are actually getting them to the people that need them," Milner said. "So you can see our running rate there but our average is about 94% of the vaccines that we have been allocated have made it into the arms of someone from our state."
The additional data dashboard resource will provide statistics and trends related to COVID-19 vaccine activity. The data will be captured and updated once a week.
These numbers will be specific to either Saint Alphonsus or St. Luke's Health System respectively and do not show any other health care organizations.
Idaho Gov. Brad Little's issued an executive order on Jan. 28 calling for more transparency in the COVID-19 vaccine rollout across the state. It requires health care providers and public health districts to report how doses of the vaccine have been allocated and how many shots have been given, ensuring vaccine doses are not being wasted or left sitting on the shelf too long.
The Idaho Department of Health and Welfare has been adding the new data to two new tabs on the state's coronavirus website.
St. Luke's and Saint Alphonsus say their data is consistent with the types of information the health care organizations have been providing to state and local health agencies since December.
Examples include:
- Total doses administered
- How many are first doses or boosters
- Total doses received
- Scheduled appointments
- Total doses on hand
- Total percentage of vaccines given
The bar chart on the dashboards show:
• Vaccine doses administered each week to people eligible to receive the vaccine, including both primer and booster doses.
• Vaccine doses received from the state of Idaho each week.
• Percent administered: vaccine doses administered each week as a percentage of the vaccine doses received each week.
Dr. Laura McGeorge is the system service line medical director for primary and specialty care at St. Luke's. She said administering the vaccine is driven by supply, which is extremely limited. Right now, they are obligated to make sure everyone who got the first dose of the vaccine also gets a second dose.
"So if we only get enough for those boosters (2nd dose), then essentially that means we can't open any new vaccine appointments and so, it will be nice as we are able to see that separately on the dashboard," McGeorge said, "but something to keep in mind, even when we get vaccine it may just be fulfilling our booster supply and not even really giving us much capacity for adding a new patient."
Health officials say their goal is to administer the vaccine to eligible groups in a timely manner. Current data will play an important role in keeping the public informed as the vaccine distribution system continues to evolve.
Facts not fear: More on coronavirus
See our latest updates in our YouTube playlist: